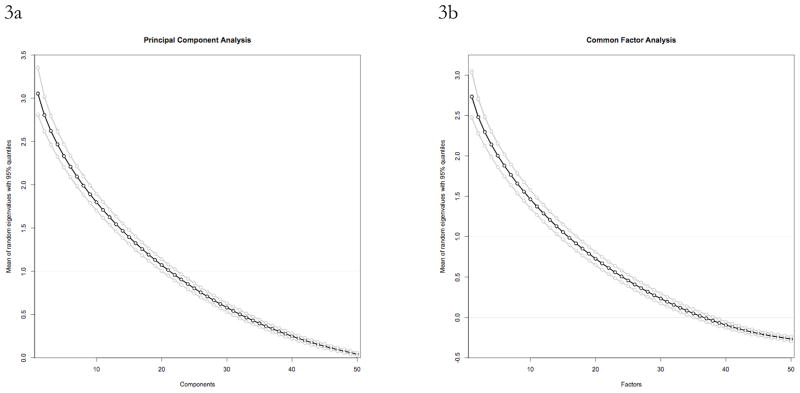
Figure 3.
Figures 3a and 3b. Plot connecting the means (black) and 95% quantiles (grey) of 5000 random eigenvalues for simulated data sets with 75 observations and 50 variables for parallel analyses conducted with ten different random data distributions for principal components analysis (3a) and factor analysis (3b). The near perfect overlap of the means and quantiles across the entire range of factors with such a small sample size illustrates the absolute or virtual insensitivity of parallel analysis to the distributional form of simulated data.

