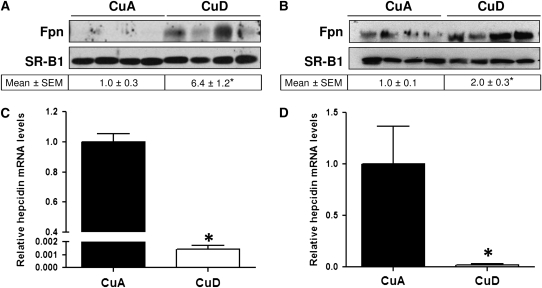
FIGURE 2 .
Hepatic Fpn protein (A,B) and hepcidin mRNA (C,D) levels in postweaning (A,C) and perinatal (B,D) CuA and CuD rats. To indicate protein loading in A and B, each blot was stripped and reprobed for SR-B1, an integral membrane protein. Values below Western blots indicate relative intensities of Fpn-immunoreactive bands. Relative hepcidin mRNA levels in postweaning (C) and perinatal (D) copper deficiency. Values represent means ± SEM, n = 4. *Different from respective CuA group, P < 0.05.

