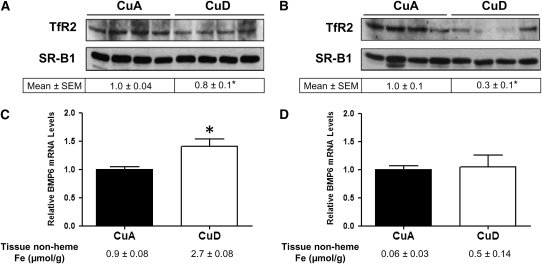
FIGURE 5 .
Hepatic TfR2 protein and BMP6 mRNA levels in CuA and CuD rats. Western blot analysis of liver TfR2 in postweaning (A) and perinatal (B) copper deficiency. To indicate protein loading, the blot was stripped and reprobed for SR-B1. Values below Western blots indicate relative intensities of TfR2-immunoreactive bands. Relative BMP6 mRNA levels in postweaning (C) and perinatal (D) copper deficiency. Values represent mean ± SEM, n = 4. *Different from respective CuA group, P < 0.05.

