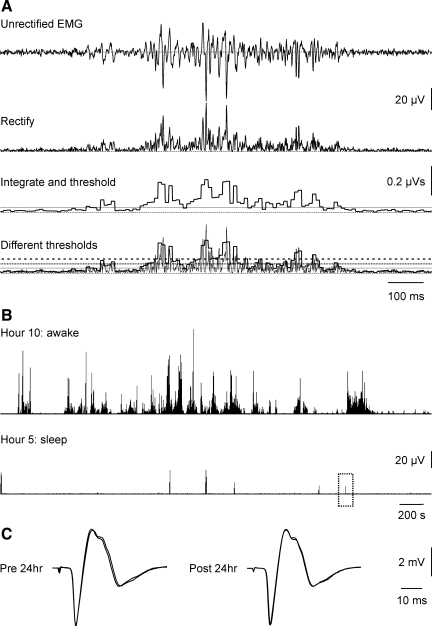
Fig. 1.
Data processing. A: records were rectified, integrated over 10-ms intervals, and defined as EMG if the integral crossed the baseline threshold [solid line; thresholds for 2% and 3% maximal voluntary contraction (MVC) are in dotted and dashed lines]. B: rectified EMG data from the right vastus lateralis (VL) of 1 subject during awake (hour 10) and sleep time (hour 5). One contraction during sleep (dotted box) has been expanded in A (top trace), then processed (bottom traces). C: examples of 2 maximal M-waves (overlaid) recorded from the same subject before and after the 24-h recording.

