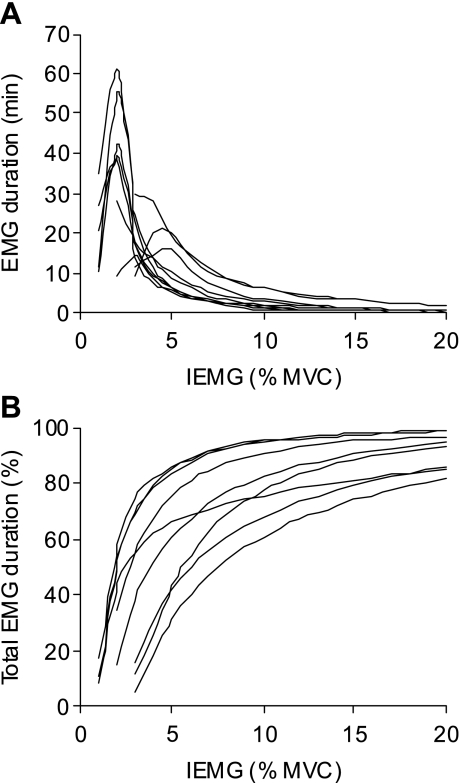
Fig. 2.
Duration-intensity relationships. Individual subject plots (n = 9) of 24-h EMG duration in minutes (A), and as a cumulative percentage of the total EMG duration (B), at a given EMG integral (IEMG) (bin width: 1% MVC). In A, the EMG duration for the weakest bin of each subject reflects a threshold that was close to the cutoff for that bin. Data for 1 subject were excluded because the last 4 h of data were not recorded.

