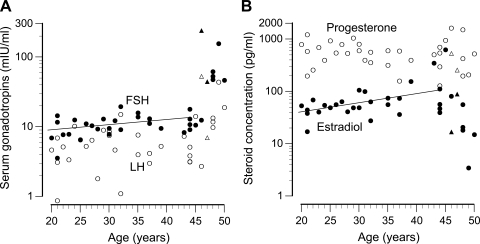
Fig. 1.
A: serum concentrations of follicle-stimulating hormone (FSH; ●) and luteinizing hormone (LH; ○) plotted by age. The line indicates the regression of FSH vs. age for women ≤45 yr old. B: serum concentrations of estradiol (●) and progesterone (○) plotted by age. The line indicates the regression of estradiol vs. age for women ≤45 yr old. All women were tested within the first 8 days of the follicular phase except two: these perimenopausal women with irregular cycles are indicated by triangles.

