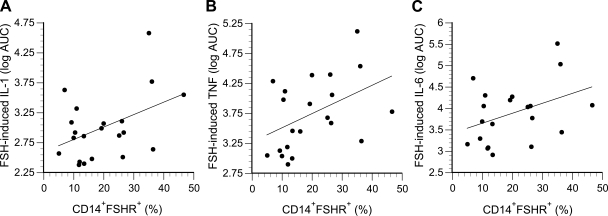
Fig. 5.
FSH-induced cytokine secretion plotted as a function of FSH receptor expression on monocytes. A: IL-1β (r = 0.44, P = 0.048); B: TNF-α (r = 0.45, P = 0.042); C: IL-6 (r = 0.40, P = 0.075). Secretion is expressed as the log of the area under the dose-response curves (AUC), as shown in Fig. 3.

