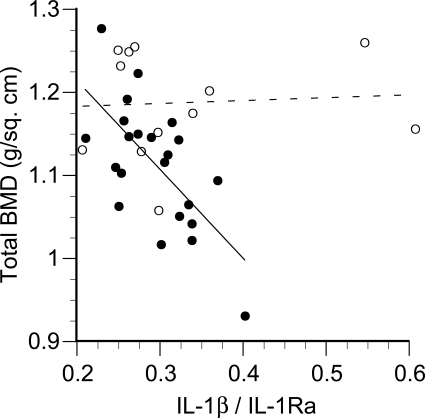
Fig. 7.
Total BMD plotted as a function of the serum IL-1β/IL-1 receptor antagonist (IL-1Ra) ratio. The solid line indicates the regression for the physically less-active women (●, r = −0.67, P = 0.0007). ○ (broken line), women in the top tertile of leisure time physical activity (≥180 min/wk, P not significant).

