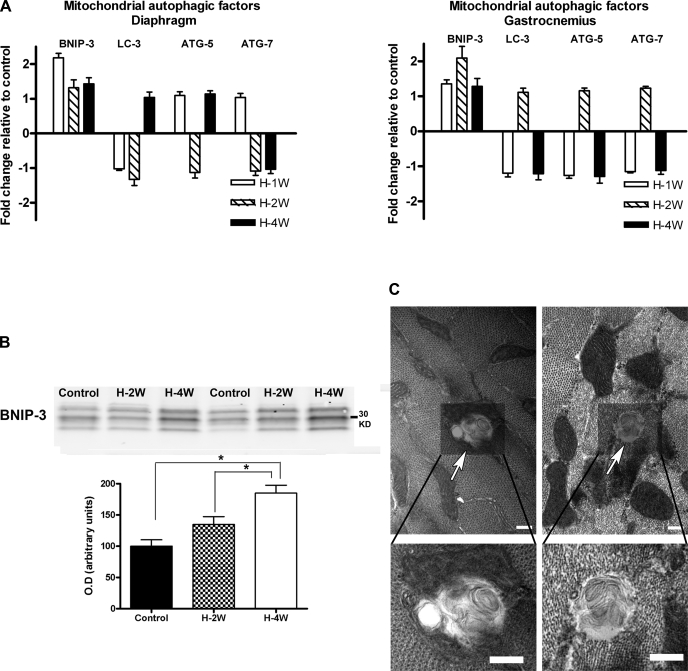
Fig. 6.
BNIP-3 expression was higher after 1 wk of hypoxia (H-1W) in diaphragm (A) and after 2 wk of hypoxia (H-2W) in gastrocnemius (B). LC-3, ATG-5, and ATG-7 mRNA levels were unchanged in either diaphragm or gastrocnemius. B: BNIP-3 protein content in diaphragm was increased after 4 wk of hypoxia of hypoxia (H-4W) compared with control (C) and 2 wk-hypoxia (H-2W) groups (*P < 0.05). No change in BNIP-3 protein content was observed in gastrocnemius. C: Electron micrographs of diaphragm fibers from mice after 4 wk of hypoxia. There were vesicles consistent with autophagosomes (top: arrows). Higher magnification views of these vesicles are shown in the lower panels (scale bar = 0.2 μm for all the images). Values are given as means ± SE (n = 6 in each group).

