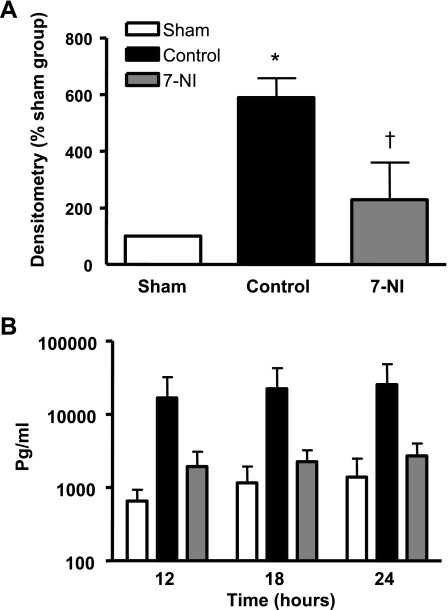
Fig. 4.
A: p65 in lung tissue at death 24 h after burn and smoke inhalation injury in densitometry % sham in the sham, control, and 7-NI groups. *P < 0.05 vs. sham; †P < 0.05 vs. control. B: IL-8 (pg/ml) in lung lymph at 12, 18, and 24 h postinjury. Data are expressed as means ± SE. At each time point, the left column represents the sham group, the middle column the control, and the right column the 7-NI group.

