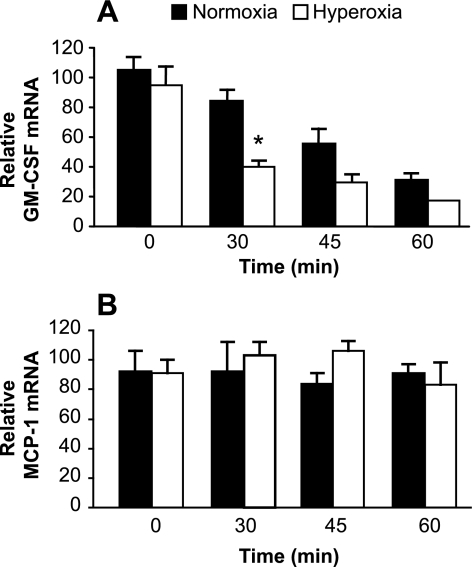
Fig. 5.
Effects of hyperoxia on stability of AEC mRNA for GM-CSF and MCP-1. AEC were placed in culture in hyperoxia or normoxia for 48 h as described in materials and methods. The AEC were then stimulated with IL-1β for 3 h before the addition of Actinomycin D (5 μg/ml) to stop transcription. A: relative mRNA for GM-CSF was measured at time points from 0 to 60 min. Black bars represent cells in normoxia; white bars represent cells in hyperoxia. Data are presented as means ± SE of triplicate samples. *P < 0.01 vs. normoxia at the same time point. The experiment is representative of 3 independent experiments. B: relative mRNA for MCP-1 was measured at time points from 0 to 60 min. Black bars represent cells in normoxia; white bars represent cells in hyperoxia. Data are presented as means ± SE of triplicate samples. There were no significant differences (P > 0.05) for comparisons between normoxia and hyperoxia at any time point. The experiment is representative of 3 independent experiments.

