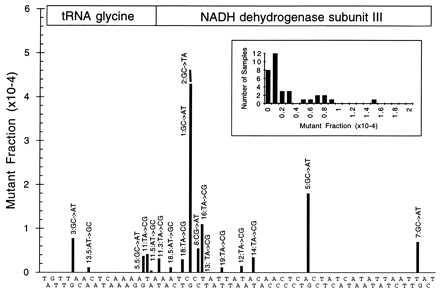
Figure 3.

Position, type of mutation, and frequency of hotspot mutations. The type of mutation and its position for each of the mutants sequenced so far are shown. The target sequence is printed along the x axis to provide information on sequence context (the sequence is staggered for clarity). The target sequence starts with T(10,031) and ends with T(10,129). The positions of the two genes encoded by this sequence, tRNAgly and NADH dehydrogenase subunit III, are designated. The height of each peak reflects the average mutant fraction of this peak in most of the lung samples analyzed to date. Note that mutants 1 and 2 are different substitutions at the same base pair. Also note that mutant 13 (T → C, base pair 10,072) was used as an internal standard to measure the size of other peaks. We estimate the average mutant fraction for mutant 13 in tissues to be 2 × 10⁻⁵ based on four samples. Error bars are not shown in this figure because the data are not normally distributed (see Discussion). Instead, the Insert demonstrates the distribution of mutant fractions among bronchial epithelial samples for a representative mutant, p11.3.
