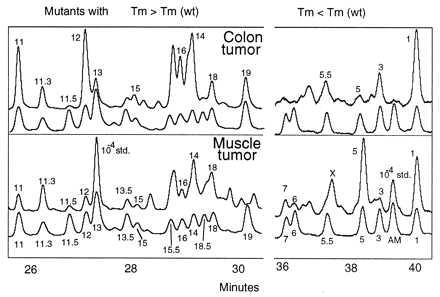
Figure 4.

Mutational spectra of colon and muscle tumor samples. The mutational spectra were determined for colon and muscle tumor samples of 1 g and 20 mg, respectively. Shown are the CDCE separations of the mutational spectra for colon and muscle tumor samples as well as the coseparations of the tetramethylrhodamine-labeled set (lower curve of each pair of curves). The axes and labels are as in Fig. 1.
