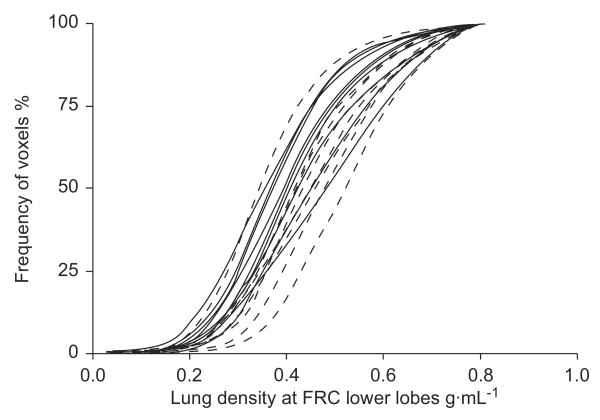
FIGURE 4.
Cumulative distribution of the lung tissue densities from the high-resolution computed tomography images obtained from the lower lobes during respiratory pause at functional residual capacity (FRC). No statistically significant differences were found between the subjects with recurrent wheeze (- - - -) and the control subjects (–––; p=0.4).

