
Figure 7.
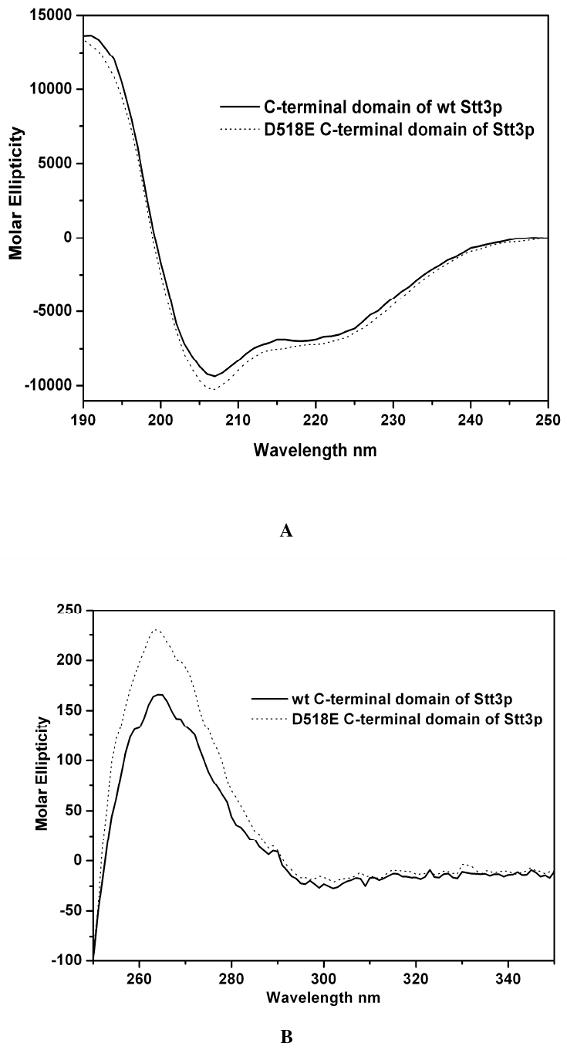
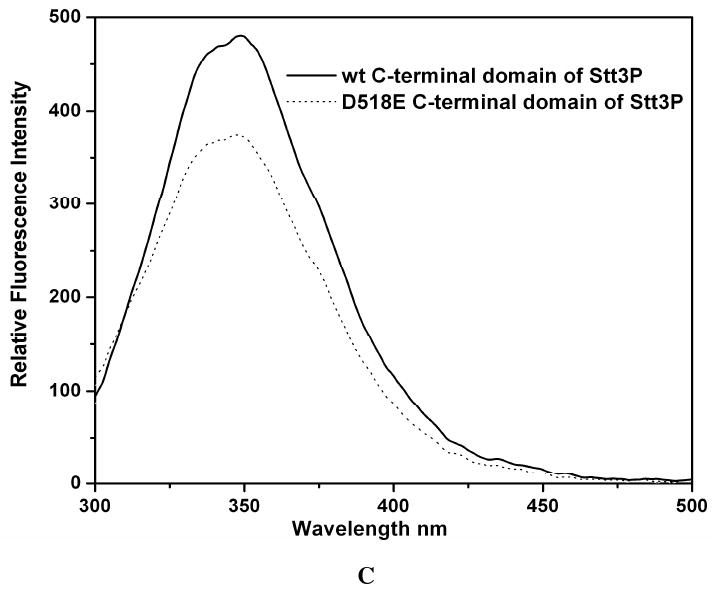
CD spectra of the wild-type and D518E mutant of the C-terminal domain of Stt3p. The data were collected under the same conditions. (A) far-UV CD spectra. The protein concentrations were 10 μM in 20 mM phosphate buffer, pH 6.5, 100 mM SDS. (B) near-UV CD spectra. The protein concentrations were 89 μM in 20 mM phosphate buffer, pH 6.5, 100 mM SDS. (C) intrinsic tryptophan fluorescence spectra. The protein concentrations were 1 μM in 10 mM phosphate buffer, pH 6.5, 100 mM SDS. The introduction of the mutation leads to an intensity quench and blue shift of the spectrum.