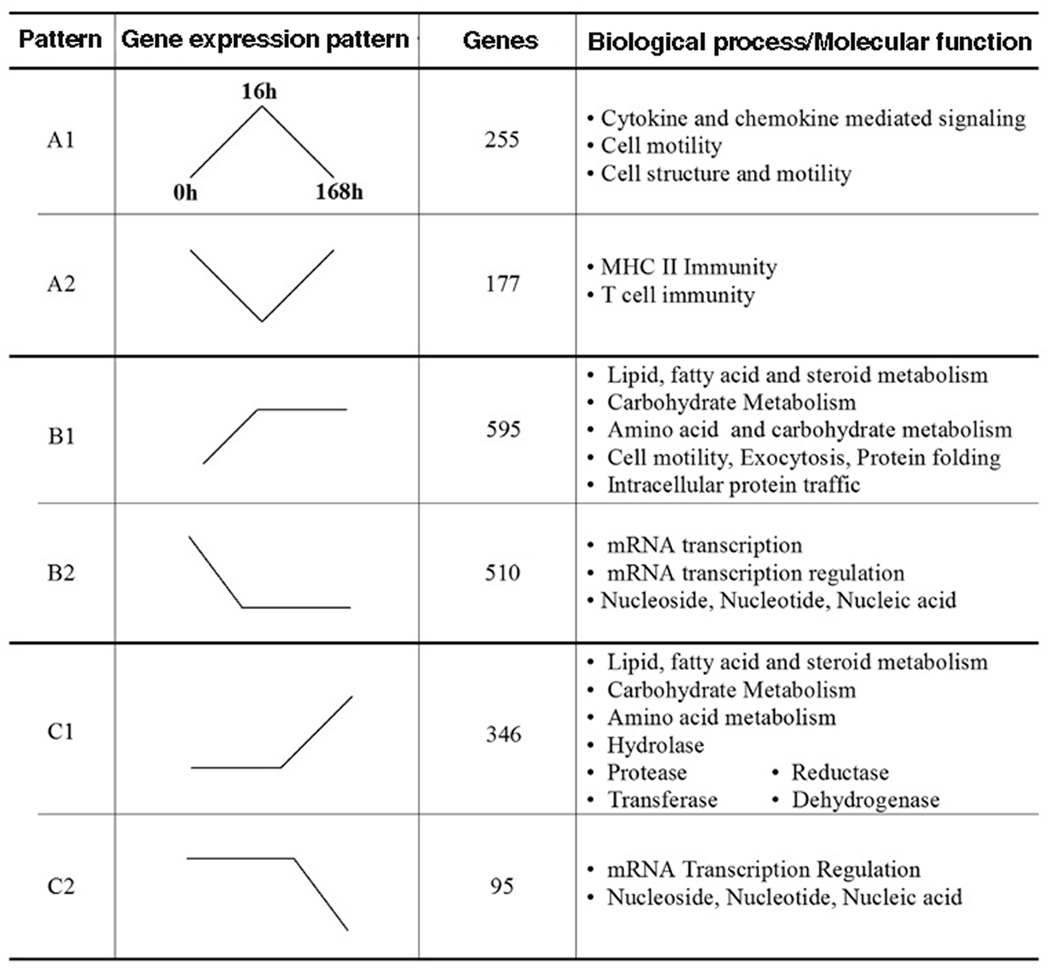
Figure 3. Patterns of gene expression during monocyte (Mono)-macrophage (MΦ) differentiation.
The patterns of gene expression (represented by the line diagrams) were identified following GO analysis. Pattern A designates categories that were up (A1) or down (A2) regulated at 16 hours, but returned to baseline by 168 hours. Pattern B represents genes up (B1) or down (B2) regulated at 16 hours, and these changes are maintained or enhanced at 168 hours. Pattern C identifies groups with no changes at 16 hours, but which are significant increased (C1) or decreased (C2) by 168 hours. The number of genes included within each pattern is represented in column 3. Potentially important signaling pathways/functions are identified in the column to the right.

