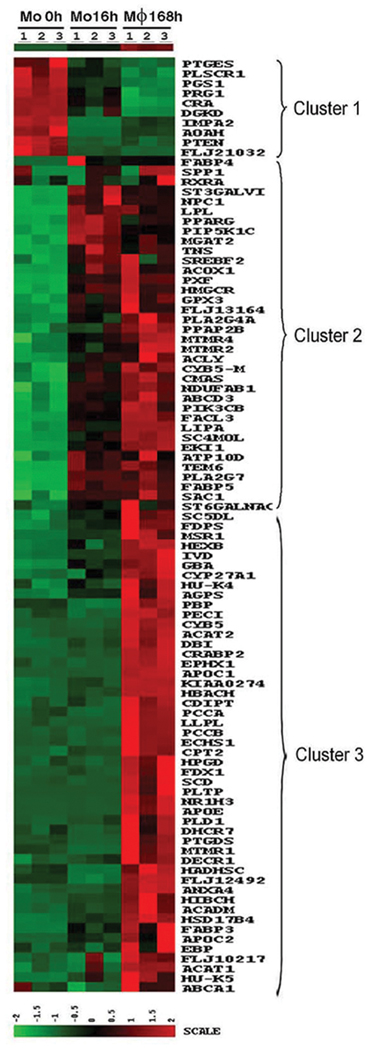
Figure 5. Heat map of lipid, fatty acid, and steroid metabolism genes differentially regulated during monocyte (Mo) to macrophage differentiation.
The genes included are those identified following GO analysis, as well as additional genes identified in other categories, which are know to be involved in foam cell function. The time points at which the cells were harvested are indicated at the top of the map, and the gene symbol for each gene is to the right of the map.

