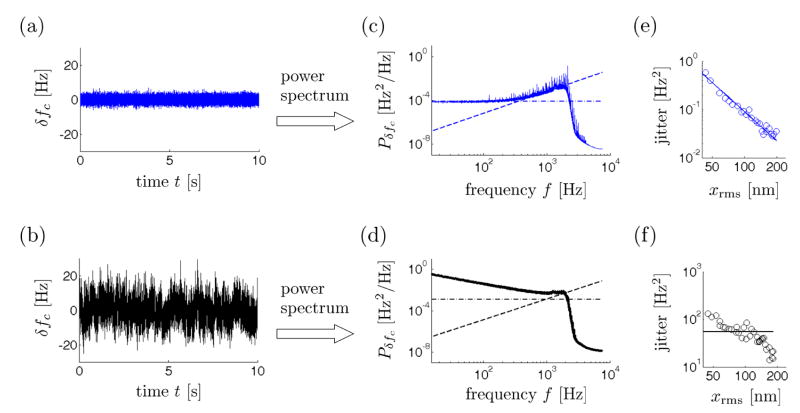
FIG. 2.
Cantilever frequency fluctuations over a 200 nm thick film of PMMA at large tip-sample separation (d = 2000 nm, upper panels, blue data) and small tip-sample separation (d = 25 nm, lower panels, black data). (a, b) Cantilever frequency fluctuations in a 2100 Hz bandwidth centered at the cantilever frequency. (c, d) Power spectra of cantilever frequency fluctuations. The lines show contributions to the cantilever frequency-fluctuation power spectra from detector noise (dashed) and thermomechanical position fluctuations (dot-dashed). Here fc = 4158Hz, kc = 0.87mN/m, and Q(d = 2000nm) = 4700 while Q(d = 25nm) = 500. The dot-dashed lines were computed using these values and eq 7. The dashed line was computed from eq 8 using the measured detector noise (d = 2000 nm) = 3.3 × 10⁻⁶ nm2/Hz and (d = 25 nm) = 6.6 × 10⁻⁶ nm2/Hz. (e, f) Cantilever frequency jitter in a 100 Hz bandwidth vs. root-mean-square cantilever amplitude. In (a–d), the cantilever amplitude was xrms = 70 nm-rms. Throughout, the tip-sample voltage was Vts = φ + 0.5 V where φ = − 0.1 V is the measured contact potential difference between the tip and the underlying gold substrate.

