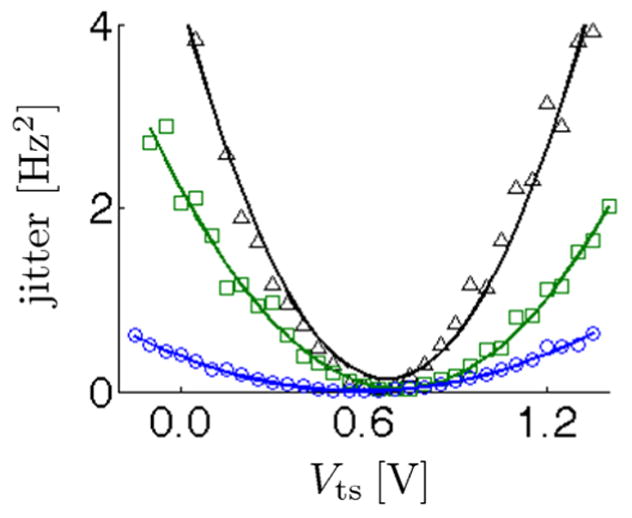
FIG. 3.

Frequency jitter vs. tip-sample voltage over a 466 nm thick PMMA film at various heights. Data (points) and parabola fits (lines) are shown for tip-sample heights of d = 75 nm (black triangles), d = 100 nm (green squares) and d = 250 nm (blue circles). The cantilever amplitude was xrms = 75 nm and the cutoff frequencies were fL = 0 Hz and fU = 100 Hz.
