
FIG. 4.
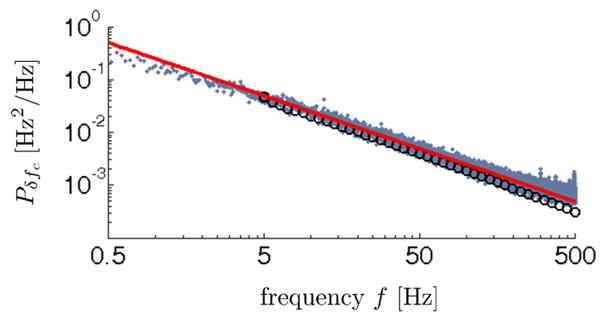
Observed and calculated power spectrum of cantilever frequency fluctuations at height d = 100 nm over a 200 nm thick PMMA film. The small blue-gray dots are the observed spectrum. The large black circles are the spectrum calculated from eqs 4–6, the measured dielectric spectrum, and the tip-sample capacitance model discussed in the text. The red line shows a 1/f spectrum, as a guide to the eye. Applied voltage Vts = 0.5 V + φ with φ = −0.1 V; and xrms = 70 nm-rms, Navg = 50, and Tacq = 25 s.