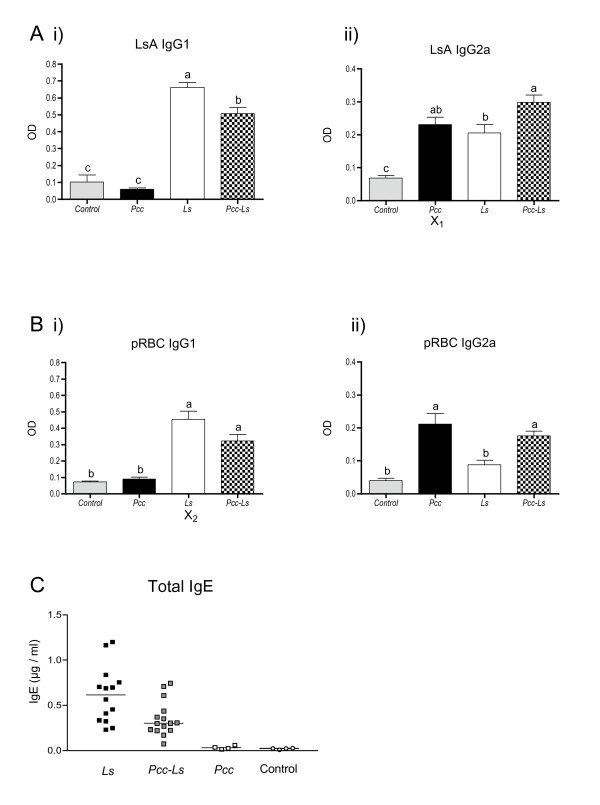
Figure 1.
Antibody isotype responses in infection and co-infection with Litomosoides sigmodontis and malaria. Mice were infected with 25 Ls L3 larvae on day 0 and/or 106 Pcc-infected RBCs on day 60 post-Ls infection. Serum antibody responses measured by ELISA at day 80 post-Ls infection to (A) Ls antigen (LsA) and (B) crude Pcc infected RBC antigen (pRBC). Th2 isotype IgG1 is shown in (Ai) and (Bi) whilst the Th1 associated isotype IgG2a is shown in (Aii) and (Bii). Grey bars represent control mice, black bars represent Pcc mice, white bars the Ls mice and the chequered bars co-infected mice (Pcc-Ls). The letter X highlights those responses that are cross-reactive. Groups not connected by the same letter denote pairs that are significantly different according to Tukey's Pairwise analysis while those that share the same letter do not differ significantly. (C) Polyclonal IgE responses. Black squares represent Ls mice, white squares represent Pcc mice and grey squares represent co-infected (Pcc-Ls) mice. White circles indicate control animals. Data shown in A & B are compiled from 3 experiments (control mice n = 13, Ls mice n = 37, Pcc mice n = 14, Pcc-Ls mice n = 41).

