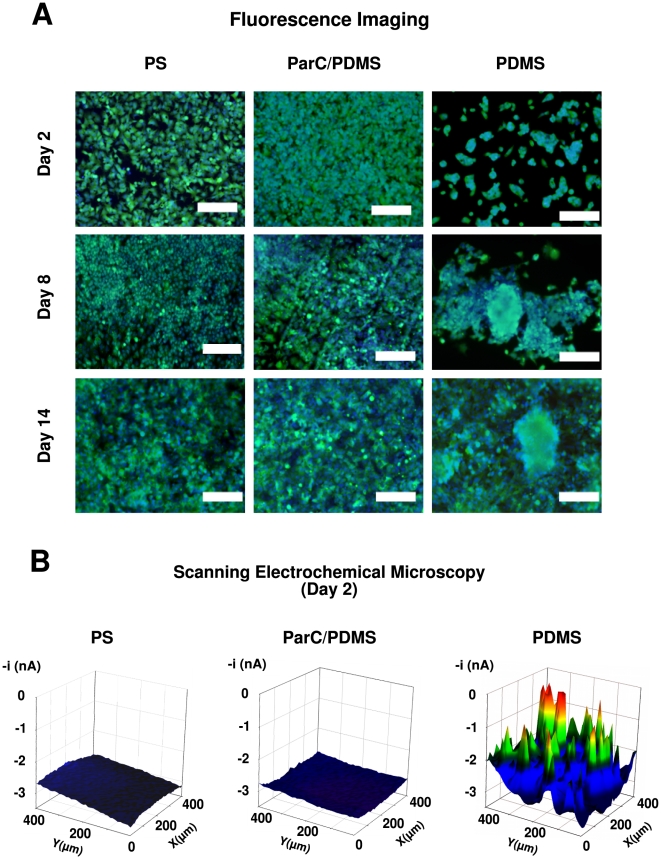
Figure 2. HepG2 cell viability and morphology.
A) Fluorescent micrographs of HepG2 cells cultured on PS, ParC/PDMS, or PDMS substrata after staining with Calcein-AM (green) and Hoechst (blue) fluorescent dyes on Day 2, 8, or 14. Scale bar = 200 µm. B) Cell topography of HepG2 at Day 2 cultured on PS, ParC/PDMS, or PDMS substrata recorded using FeCN6
4- oxidation potential for SECM ( = 5 mmol/L, Eapplied = 0.5 V vs. Ag/AgCl). Scan area = 400×400 µm.

