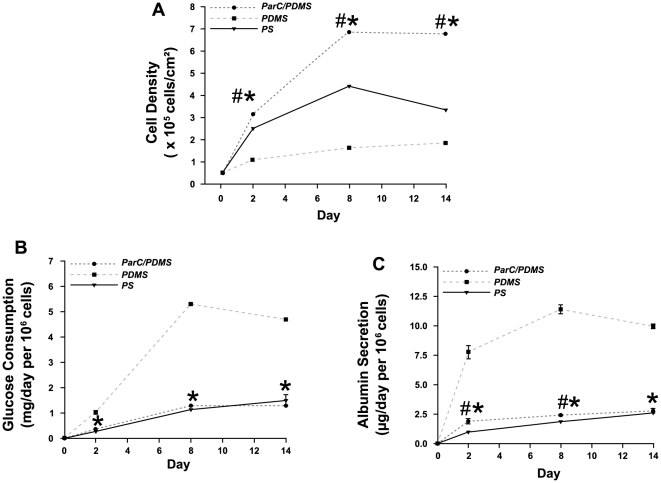
Figure 3. HepG2 cell proliferation and metabolic activity.
A) HepG2 cell surface density, (B) normalized glucose consumption, and (C) normalized albumin secretion for up to 14 days of culture on PS (--▴--), ParC/PDMS (--•--), or PDMS (--▪--) substrata. Data are expressed as mean of three to six normalized values obtained from three separate experiments.

