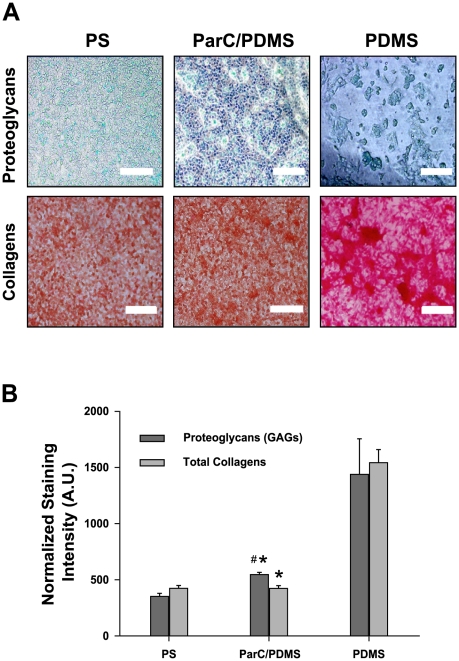
Figure 4. ECM component analysis.
A) Phase contrast light micrographs of HepG2 cells exposed to Alcian blue and Sirius red for total proteoglycan and collagen synthesis analysis, respectively, after two days of culture on PS, ParC/PDMS, or PDMS substrata (n = 5 per condition). Scale bar = 50.0 µm. B) Staining intensities normalized to 106 cells for each substratum. Data are expressed as mean of five normalized values obtained from three separate experiments.

