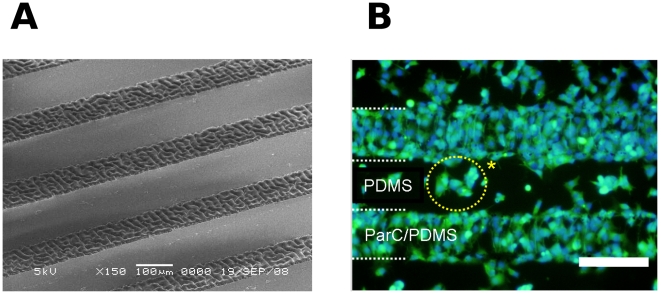
Figure 6. HepG2 cells on ParC/PDMS micropatterns.
A) Scanning electron micrograph of ParC/PDMS micropatterns. Scale bar = 100 µm. B) Fluorescent micrograph of HepG2 cells on ParC/PDMS micropatterns after two days of culture and stained with Calcein AM (green) and Hoechst (blue) fluorescent dyes. Scale bar = 200 µm.

