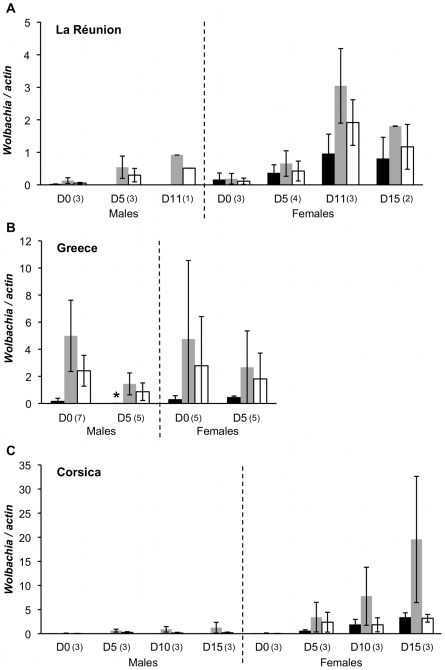
Figure 2. Effect of aging on Wolbachia and WO prophage densities.
The age is indicated on the x axis as days (D) after emergence, for males and females separately. Plots report average wAlbA (black), wAlbB (grey) and WO prophage (white) density for each age and sex in samples from (A) La Réunion Island, (B) Greece (* the very low but non-zero density seen in 5-days-old males from Greece is not visible on the figure (mean = 3.4×10⁻³; standard error = 4.2×10⁻³)), and (C) Corsica. Numbers into brackets indicate the number of individuals analysed.

