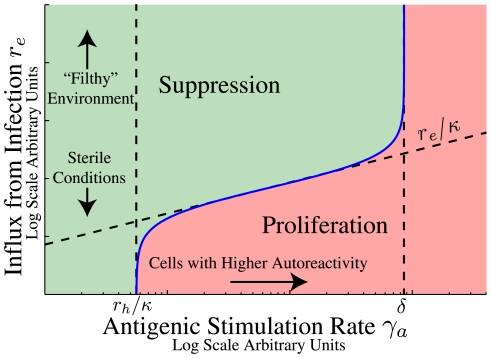
Figure 3. Illustration of a threshold for suppression by passive attrition.
This threshold is defined by Eq. 6 separating conditions for suppression (green region) and proliferation (pink region) of autoreactive cells. The vertical axis is the influx from infection  . This quantity is typically controlled by the external environment and is expected to be proportional to the infection rate. The lower portion of the figure represents cells in a more sterile environment and the upper portion of the figure a filthy one with frequent infections. The horizontal axis is the antigenic stimulation rate
  for a small population of autoreactive cells
  . Cells with antigenic stimulation rate less than
  (the homeostatic influx divided by the number of cells in the niche at equilibrium) are always suppressed though for some niches
  . No populations with
  (where
  is the apoptotic rate under high levels of competition for survival factor) can be suppressed by passive attrition because the division rates of these cells (from autoantigen exposure) are large enough to maintain the population even in the absence of survival factors.

