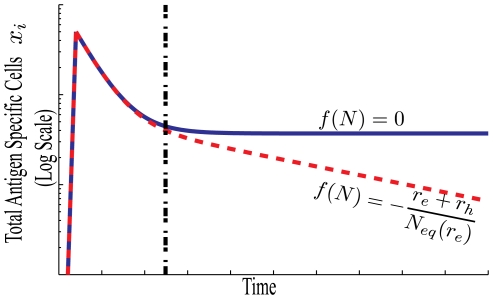
Figure 4. Memory formation with and without passive attrition.
For both scenarios the number of antigen specific cells quickly rises during an immune response, then rapidly decreases until the total cell number is approximately at equilibrium,  , as indicated by the black dashed line. The blue curve illustrates the case with no passive attrition, where
  , and
, and  . CD
. CD memory in a sterile environment is representative of this (blue) scenario. The red curve illustrates the scenario where new cells are frequently added to the niche shared by the specific memory, causing the number of antigen specific cells to decline over time.

