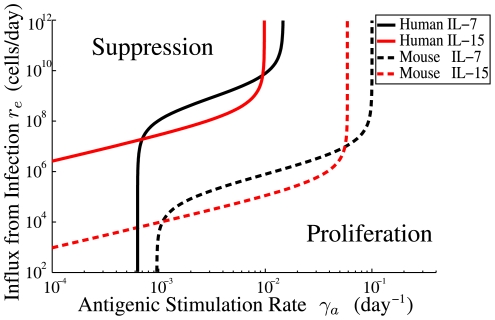
Figure 6. Boundaries discriminating between autoreactive cell populations that are suppressed vs those which proliferate, for humans (solid lines) and mice (dashed lines).
The condition for suppression is given by Eq. 19 and 25 and the numerical values of the parameters are found in Table 1. The features of these curves are discussed in the caption to Fig. 3. CD memory T cells belong to the IL-15 niche (red lines). The model predicts that for CD
 T cells which are in the IL-7 niche (black lines), all autoreactive populations
  with antigenic stimulation rates
  below
below  are suppressed by the homeostatic influx of naive T cells. Passive attrition can not suppress autoreactive cells with
  .
.

