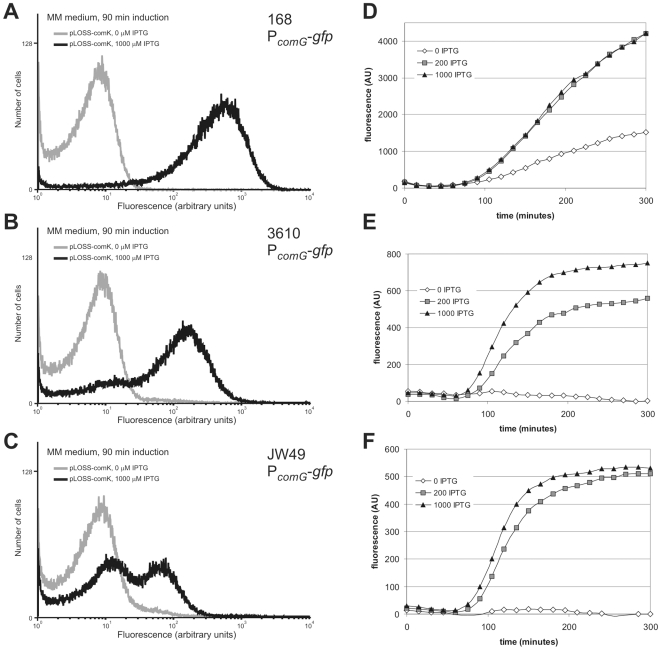
Figure 3. Expression of PcomG-GFP in environmental B. subtilis strains.
(A–C) Exponentially growing cells (MM medium) were induced for 90 minutes with or without 1000 µM of IPTG. Expression of GFP from the comG promoter was analysed by flow cytometry. At least 100.000 cells were analysed for each sample. (D–F) PcomG-GFP expression of the total population after induction with 0, 200 and 1000 µM IPTG, measured using a microtitre plate reader. Note that the timing between data from panels A–C and D–F cannot be directly compared due to the different experimental setups.

