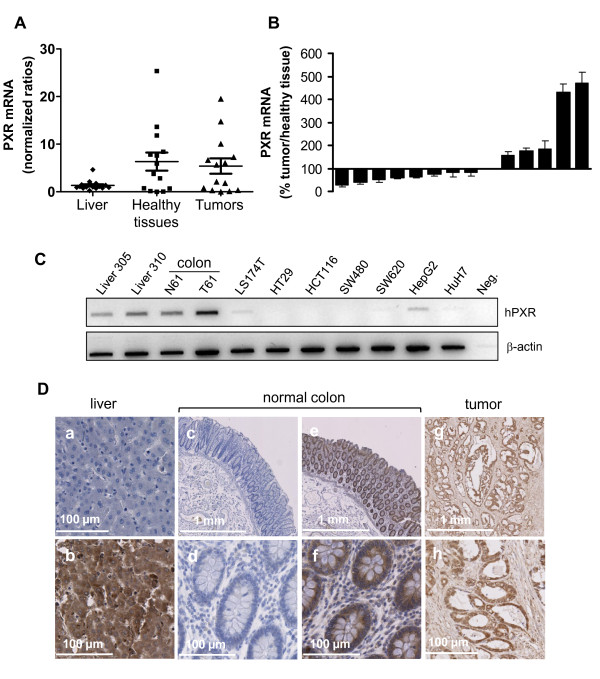
Figure 1.
Evaluation of PXR expression in human colorectal tissues and cell lines. A, PXR mRNA expression measured by quantitative real-time PCR in human livers (n = 17) and colon samples (tumoral and healthy adjacent tissue, n = 14). Bars on graph represent mean PXR mRNA expression and SEM. B, Percentage of PXR expression in colon tumors compared to adjacent healthy tissue; bars, SEM. C, PXR mRNA expression in various colon (LS174T, HT29, HCT116, SW480, SW620) and hepatic (HepG2, HuH7) cell lines compared to livers (FT305 and 310) and to normal (N61) and tumoral (T61) colon tissues. D, Immunocytochemical staining for PXR on liver, normal colon and tumors tissues. Liver was used as positive control for PXR expression (b), photos a, c and d display negative controls without primary antibody.

