Figure 2.
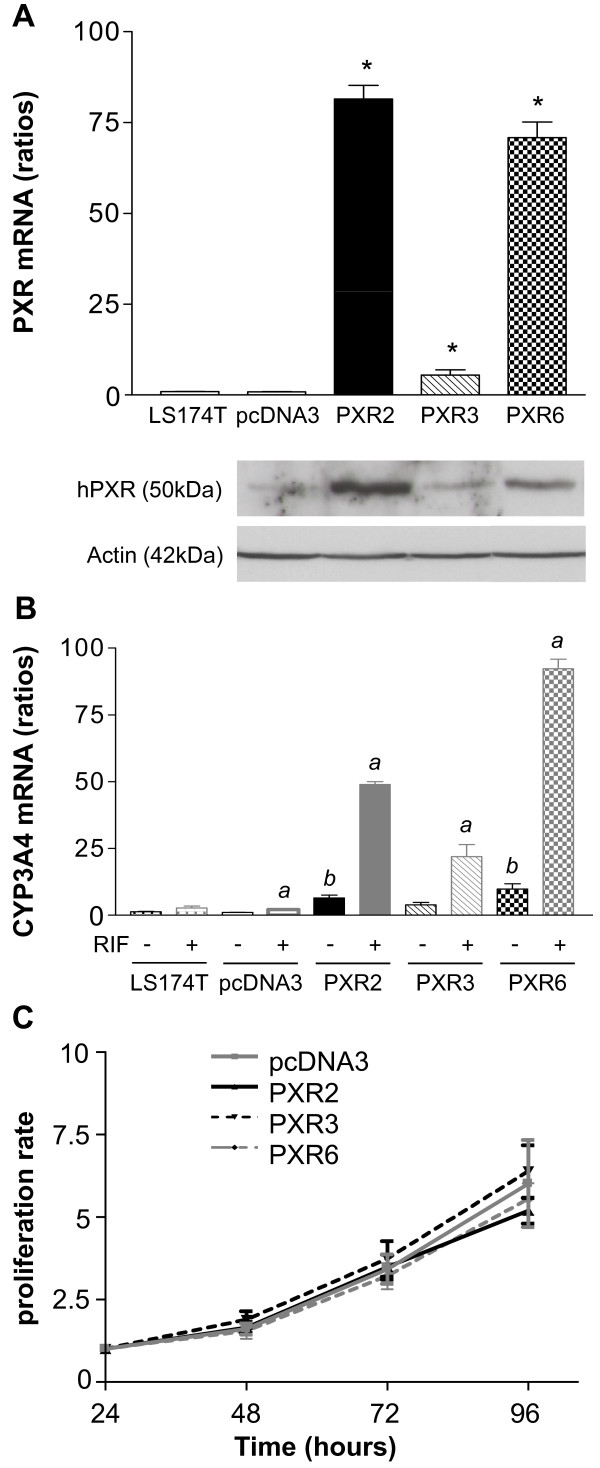
Characterization of LS174T PXR-transfected cells. A, PXR expression level in parent LS174T, pcDNA3-transfected and stable clones PXR2, PXR3 and PXR6 (top: mRNA expression level; bottom: protein expression level). * p < 0.05, PXR expression of stable clones compared to parent and pcDNA3-transfected cells, assayed by Mann and Whitney test. B, CYP3A4 mRNA expression levels of CTRL and PXR overexpressing clones treated 24 h by solvent (0.1% DMSO) or 10 μM rifampicin in serum-free medium. Results were obtained from three separate experiments; bars, SEM. a, CYP3A4 expression of cells treated by rifampicin compared to the vehicle treated groups, b, CYP3A4 expression of vehicle treated stable clones compared to vehicle treated; assayed by Mann and Whitney test (p < 0.05). C, proliferation rate of cell lines. Cells were seeded in six-well plates at 5 × 10⁵cells/well and counted at the indicated times after seeding (Z1 counter, Beckman Coulter). Data from three separate experiments; bars, SEM.

