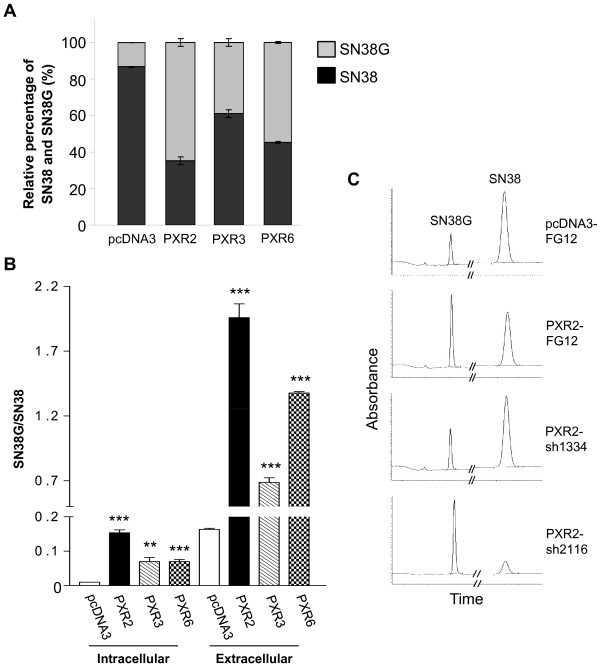
Figure 6.
HPLC quantification of SN38 and SN38G A, Relative percentage of total amounts (intra- and extracellular) of SN38 and SN38G on pcDNA3, PXR2, PXR3 and PXR6 cells after 24 h incubation with 10 μM SN38. Results were obtained from three separate experiments; bars, SEM. B, Intracellular and extracellular SN38G/SN38 ratios on pcDNA3, PXR2, PXR3 and PXR6 cells after 24 h incubation with 10 μM SN38. Results were obtained from three separate experiments; bars, SEM. *** p < 0.001, ** p < 0.01, * p < 0.05 (student's t-test) compared to CTRL cells. C, representative chromatograms of extracellular medium of pcDNA3-Mock, PXR2-Mock, PXR2-sh1334 and PXR2-sh2116 cells exposed to SN38.

