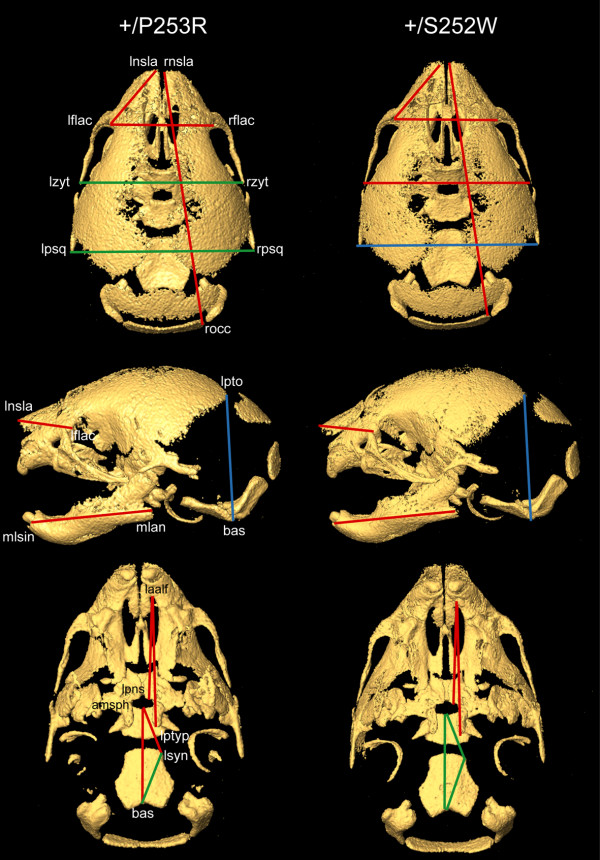
Figure 3.
Morphometric analyses of the skulls of Fgfr2+/P253R and Fgfr2+/S252W mice. EDMA results from intra-model comparisons between mutant and normal littermates (for further details see Table 1). From top to bottom: superior, lateral and inferior views of micro-CT 3D reconstructions of the skull of a Fgfr2+/P253R mouse on the left, and of a Fgfr2+/S252W mouse on the right. Red lines indicate linear distances that are significantly shorter in both mutants in comparison with their littermate controls; blue lines represent linear distances that are significantly longer in mutants in comparison to their littermate controls; and green lines show linear distances that are similar in mutants and littermate controls (i.e. no statistical significant differences at the α = 0.1 level).

