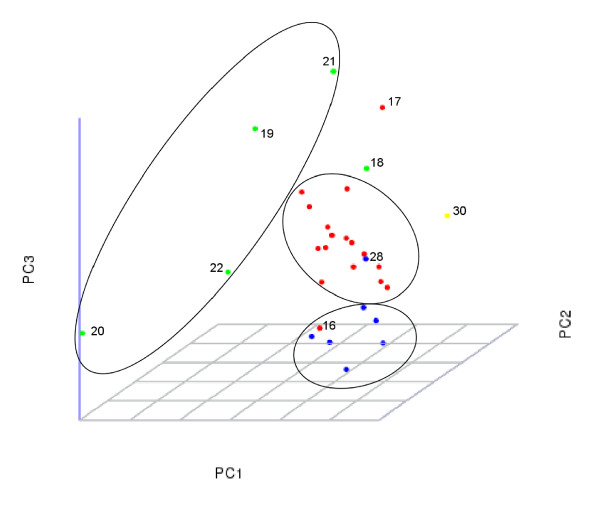
Figure 4.
Principal Component Analysis (PCA) of domain frequencies. The PCA plot is based on 21 domain frequencies in all 30 fungi (i.e. domains present in at least half of the fungi, see Additional File 4), projected onto three uncorrelated axes (principal components). The PCA analysis revealed two tight clusters for Ascomycota/Pezizomycota (red dots) and Saccharomycotina (blue dots) groups, and a more spread, but still distinguishable, cluster for Basidiomycetes (green dots). Ellipsoids enclose the clusters for clarity. The only representative of Ascomycota/Taphrinomycotina (S. pombe) dot 30 (in yellow), forms its own singleton cluster. Species numbers (according to Table 1) are given for some dots, for reference in the text.

