
Figure 1.
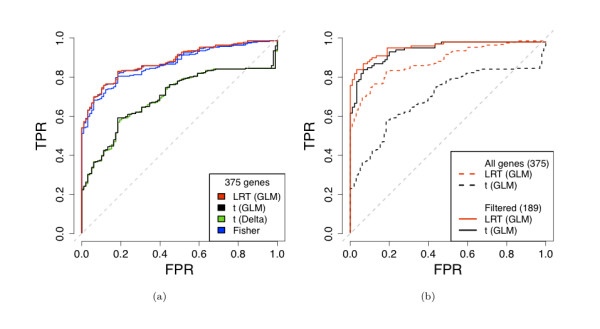
Comparison of differential expression statistics: ROC curves. (a) All DE statistics, no gene filtering. (b) GLM-based likelihood ratio statistics and t-statistics, before and after removing genes with fewer than 20 reads in either Brain or UHR. In both plots, a gene was declared non-DE if its qRT-PCR absolute log-ratio was less than 0.2 and DE if its absolute log-ratio was greater than 2.0. Note that we require a true positive to be differentially expressed in the same direction according to both mRNA-Seq and qRT-PCR (see Table 1 and Methods).