
Figure 7.
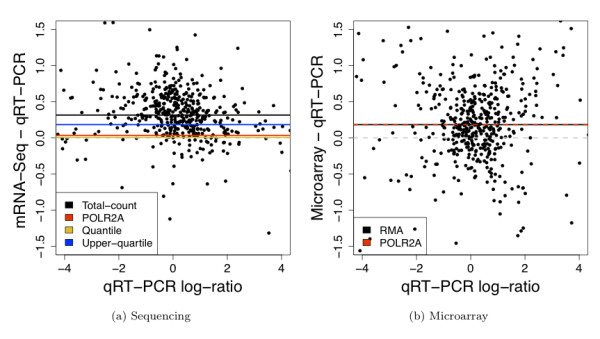
Comparison of mRNA-Seq and microarray differential expression measures to qRT-PCR. Difference scatterplots comparing the estimates of UHR/Brain expression log-ratio from qRT-PCR to those from (a) mRNA-Seq, using the standard total-count normalization, and (b) microarrays, using the standard RMA normalization. Shown are the genes shared between all three platforms, present in both Brain and UHR according to both mRNA-Seq and qRT-PCR (see [Additional file 2: Supplemental Section S1]), and having absolute qRT-PCR expression log-ratio less than 4. Horizontal lines in (a) represent the median UHR/Brain log-ratio for the sequencing data after the standard total-count normalization (black), POLR2A normalization (red), quantile normalization (yellow), upper-quartile normalization (blue); horizontal lines in (b) show the median UHR/Brain log-ratio for the microarray data after the standard RMA normalization (black) and POLR2A normalization (red).