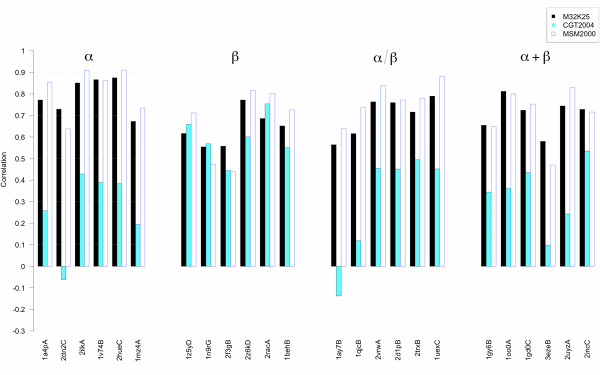
Figure 9.
Barplot of the Pearson correlation coefficients between RMSF and local-fit Shannon Entropy profiles. The 24 proteins are ordered according to the SCOP class and, within a given class, to decreasing fraction of structured DSSP [55] elements. M32K25 values are reported in black, CGT2004 in light blue and MSM2000 as empty bars.

