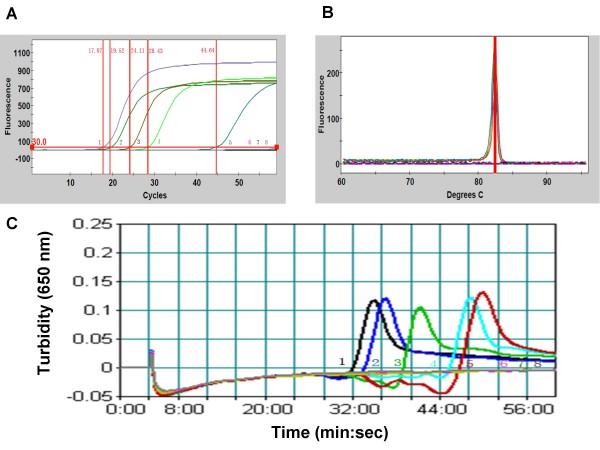
Figure 1.
Sensitivity of the LAMP assay when detecting Vibrio parahaemolyticus ATCC 27969 in pure culture. (A) A representative optic graph generated using the real-time PCR machine; (B) Corresponding melting curve analysis for samples in (A); (C) A representative turbidity graph generated using the real-time turbidimeter. Samples 1-7 corerspond to serial 10-fold dilutions of V. parahaemolyticus ATCC 27969 cells ranging from 4.7 × 10⁵ to 4.7 × 10⁻¹ CFU/reaction; sample 8 is water.

