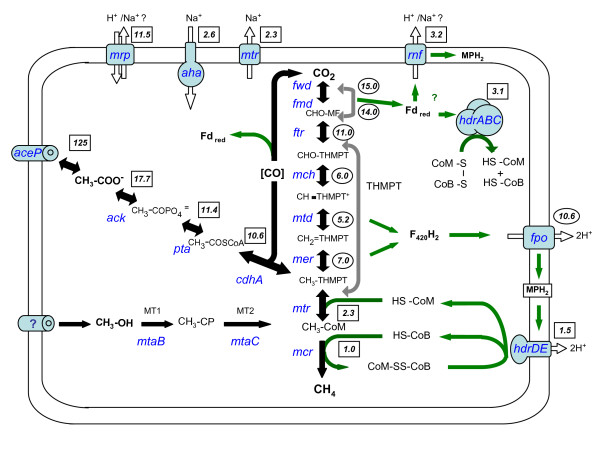
Figure 8.
Overview of differential gene expression in M. acetivorans in response to methanol versus acetate utilization. A boxed number indicates the fold-increase in mRNA levels seen for the indicated gene(s) during acetate versus methanol growth conditions. A circled number indicates the fold-increase in mRNA levels during methanol versus acetate growth conditions. All data are from this study except for the mcr, mtr, mer, mtd, mch, and ftr gene ratio data derived from a prior microarray study [6]. The genes/enzymes are: ack, acetate kinase; pta, phosphotransacetylase; cdh, carbon monoxide dehydrogenase; MT1, mtaB2 methyl transferase 1; MT2, mtaA, methyltransferase 2; mcr, methylcoenzyme M reductase; mtr, methyl -H4 MPT:HSCoM methyltransferase; mer, methylene -H4 MPT reductase; hmd, methylene -H4 MPT dehydrogenase; mch, methenyl -H4 MPT cyclohydrolyase; ftr, formyl MFR:H4MPT formyl transferase; fmd, formyl methanofuran dehydrogenase Mo-type; fwd, formyl methanofuran dehydrogenase W-type; fpo, F420 H2 dehydrogenase; hdr, heterodisulfide reductase; rnf, Rnf-type complex; mrp, Mrp-type complex. The control gene was MA3998. Methanophenazine is represented by MPH. The proposed acetate transporter protein is indicated by AceP while the unknown transporter(s) for one carbon compounds is indicated by a question mark.

