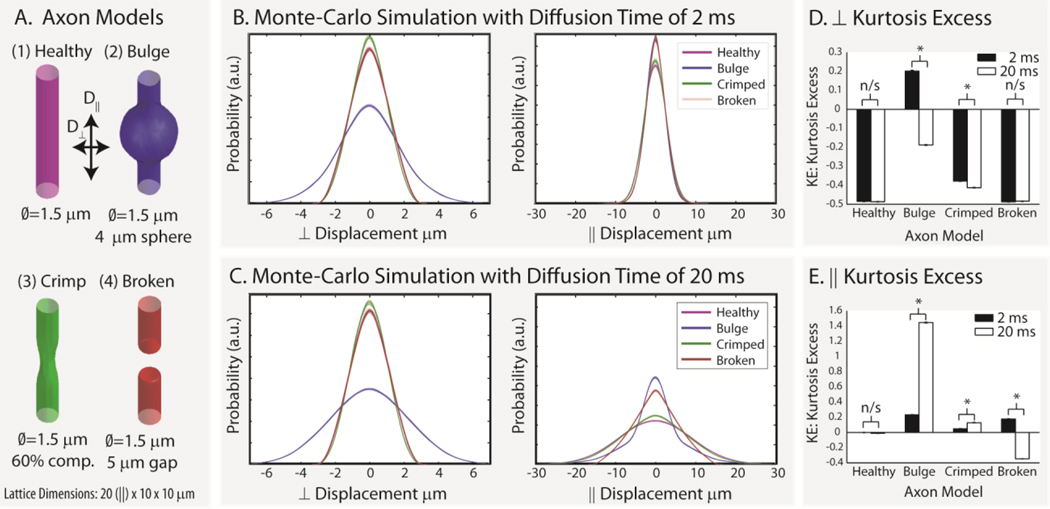
Figure 4.
Simulated axon damage. Four geometrical models of axon damage (A) were simulated for 2 ms (B) and 20 ms (C) with 25 repetitions each. The resulting motion-probability propagators are shown as overlaid individual lines for parallel and perpendicular diffusivity. Note that the differences in simulated probability and kurtosis excess (D and E) depend on geometric model, diffusion time, and the displacement direction (i.e., diffusion perpendicular (⊥) or parallel (‖ to the long axis of the “axon”). Error bars in D and E show the standard deviation in kurtosis excess, and * indicates significance at the p<0.01 level.

