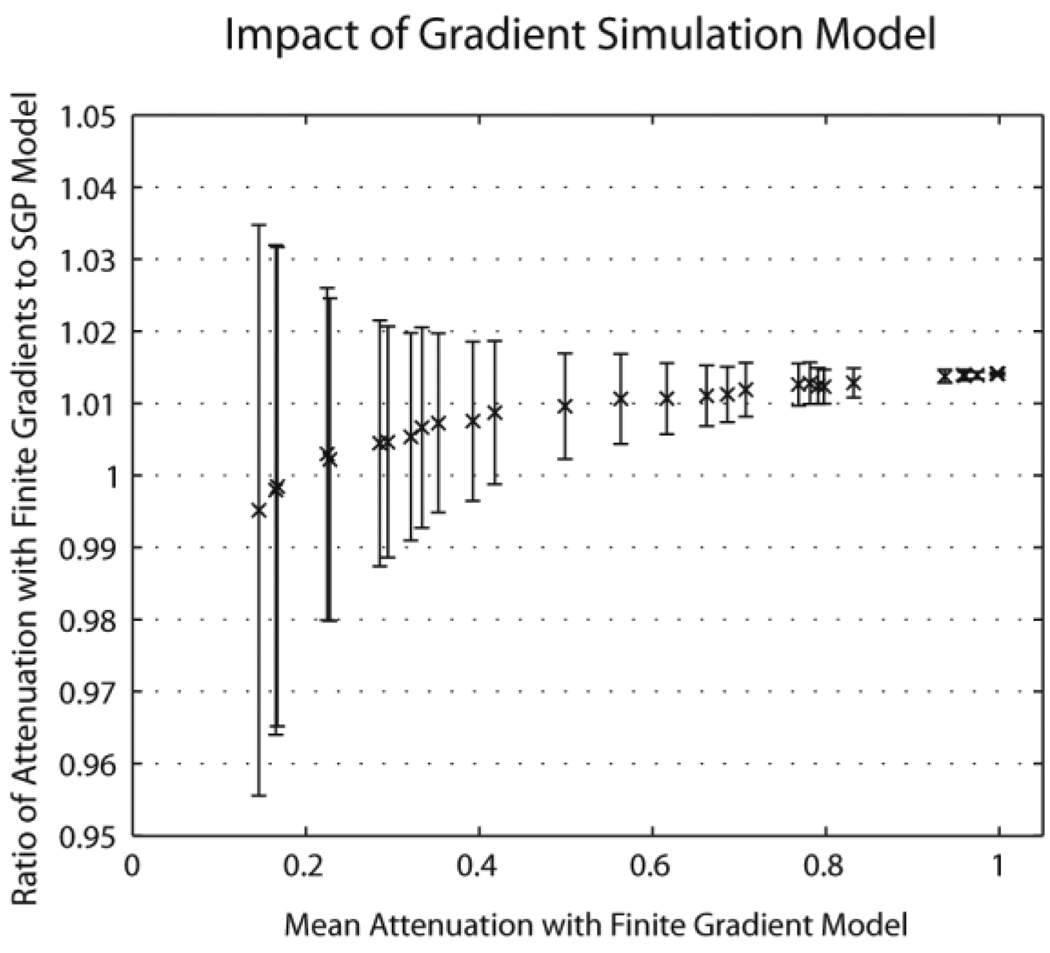
Figure 6.
Simulation of finite duration diffusion encoding gradients. For each of 30 diffusion encoding directions, the mean simulated attenuation was calculated with a finite gradient model (horizontal axis) and the SGP model was compared with each Monte Carlo simulation (vertical axis). Symbols indicate the mean difference while error bars indicate the standard deviation of the observations.

