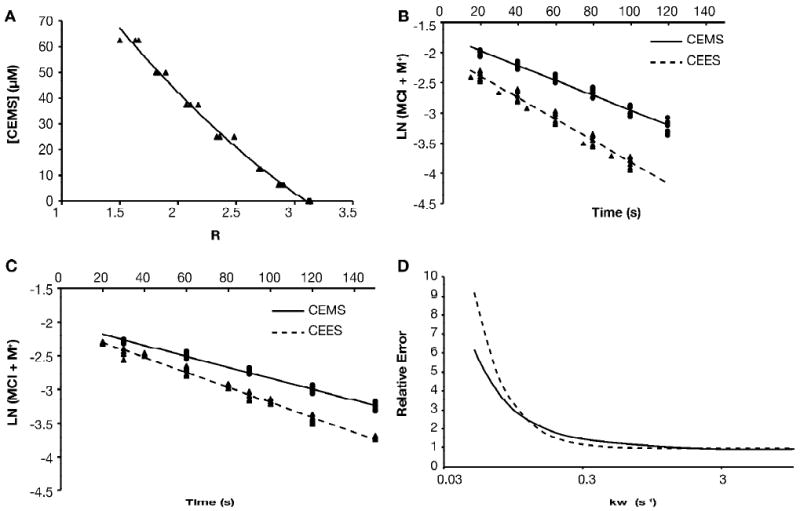
Figure 3.

Measurement of hydrolysis rate constants
A. To prepare standard curves, reactions were set up containing 50 μM 6MP and from 6.25 to 62.5 μM CEMS and allowed to go to completion. Absorbance spectra were obtained and the ratio of A320/A293 =R was calculated. The smooth line represents the best fit of the data to a quadratic equation; the best-fit equation was then used to convert experimental R values to [CEMS]. Standard curves were prepared daily; all data points from a representative standard curve are shown. Similar curves were obtained for CEES. B. Ethanolic solutions of CEMS or CEES were diluted to 0.125 mM in aqueous solution with no added NaCl, and at the indicated times aliquots were mixed with 6MP and allowed to react to completion. R values were calculated from absorbance spectra and converted to give the concentration of CEMS remaining unhydrolyzed at the given time point; the natural logarithm of the unhydrolyzed mustard concentration is plotted. All data points from 8 independent determinations for CEMS (circles, solid line) and 8 independent determinations for CEES (triangles, dashed line) are shown, along with the linear least squares regression lines, calculated for all data. The regression analysis provides estimates of k1 (the slope of the line) and 95% confidence limits for that estimate. C. Data was obtained and analyzed as in panel B, but with 12.5 mM NaCl present in the initial hydrolysis reaction. The resulting linear relations between k-1 and kw were as follows: CEMS k-1 = (0.497 × kw - .00404)/[Cl-]; CEES k-1 = (0.583 × kw - .00648)/[Cl-] × kw. D. Numerical integration was used to calculate reaction progress curves for the hydrolysis of CEMS or CEES in the presence of 12.5 mM NaCl for a range of assumed values of kw from 0.05 to 10 s-1. The experimental data points (panel C) were compared to the calculated data by summing the squared deviations, and normalizing to that obtained with kw=5 s-1. The error functions calculated for CEMS (solid line) or CEES (dashed lines) are shown.
