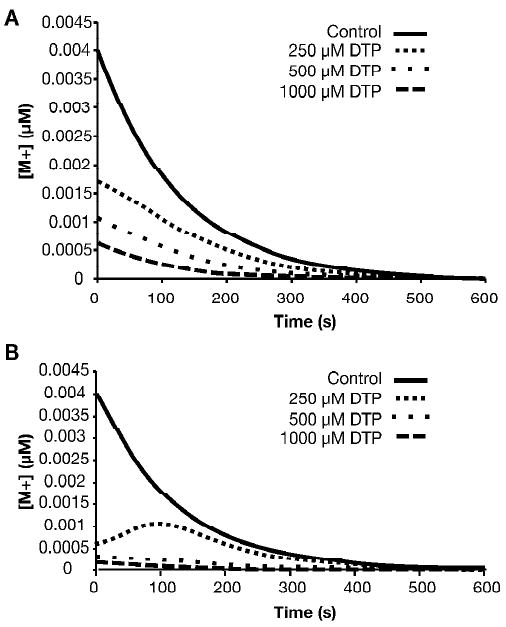
Figure 5.

Reaction progress curves for [M+]
Numerical integration was used to calculate time-dependent changes in the concentration of M+, for CEMS in the presence of the indicated concentrations of (A) DTP or (B) MMP, utilizing the best fit values of k2 with kW set at 1.0 s-1.
