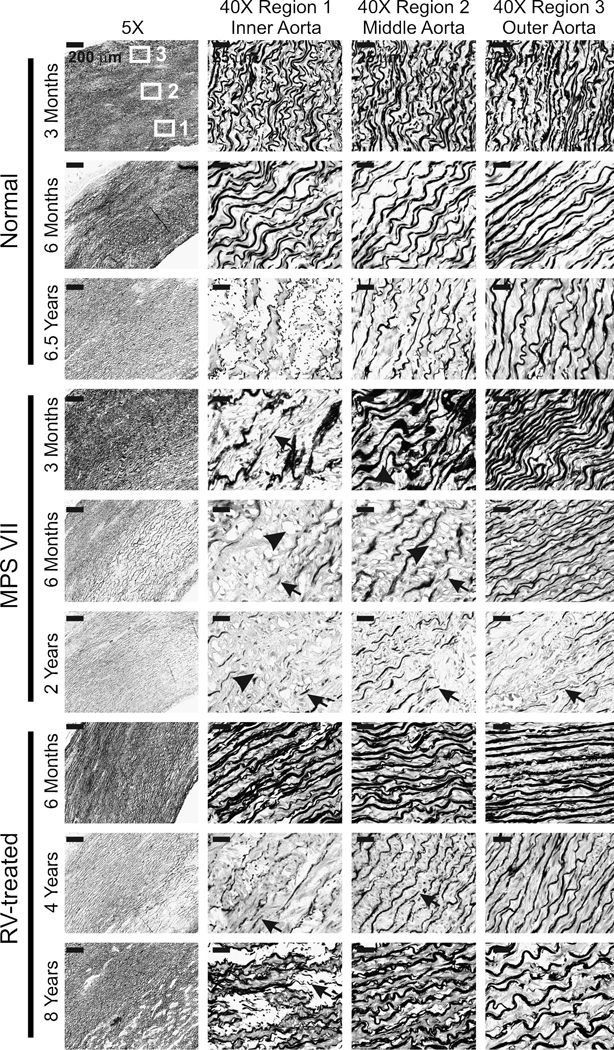
Fig. 2. Elastin stain in MPS VII dog aortas.
Aortas were obtained from normal, untreated MPS VII, or RV-treated MPS VII dogs. Sections were stained with VVG, which stains elastin dark, and representative examples are shown here, which are quantified for all animals that were evaluated in Fig. 3. The left panels show low power images, where the intima is located at the lower right and the adventitia is at the upper left, and the scale bar is 200 µm. The boxes identify Region 1 (inner media), Region 2 (middle media), and Region 3 (outer media) where high power images were obtained, which are shown in the 3 columns to the right, where the scale bar represents 25 µm. In some panels, the black arrows identify fragmented elastin fibers and black arrowheads identify the clear-appearing lysosomal storage. For RV-treated dogs, M2420 (317 U/ml of serum GUSB activity), M1653 (88 U/ml), and M1337 (281 U/ml) were evaluated at 6 months, years, and 8 years, respectively.

