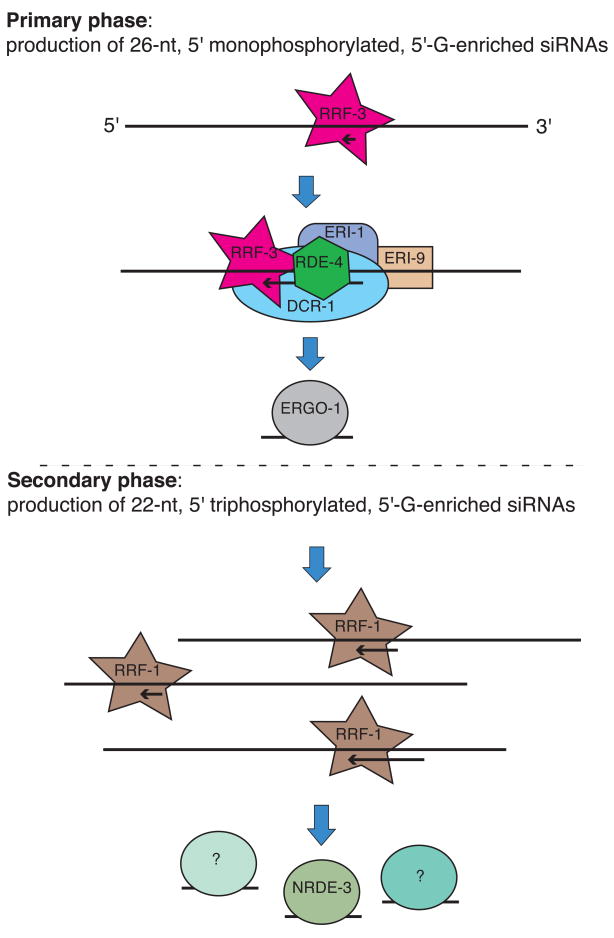
Figure 6. A model of the somatic ERI pathway.
All factors implicated by our data in the somatic ERI pathway are included in the model. The dashed line through the center represents a conceptual division between the primary and secondary phases of the pathway; our data do not exclude more complicated feedback mechanisms in either direction. The Argonautes labeled with a “?” are included to indicate that NRDE-3 may be one of multiple Argonautes with a substantial role in the secondary phase. The NIHMS has received the file ‘mmc1.pdf’ as supplementary data. The file will not appear in this PDF Receipt, but it will be linked to the web version of your manuscript.

