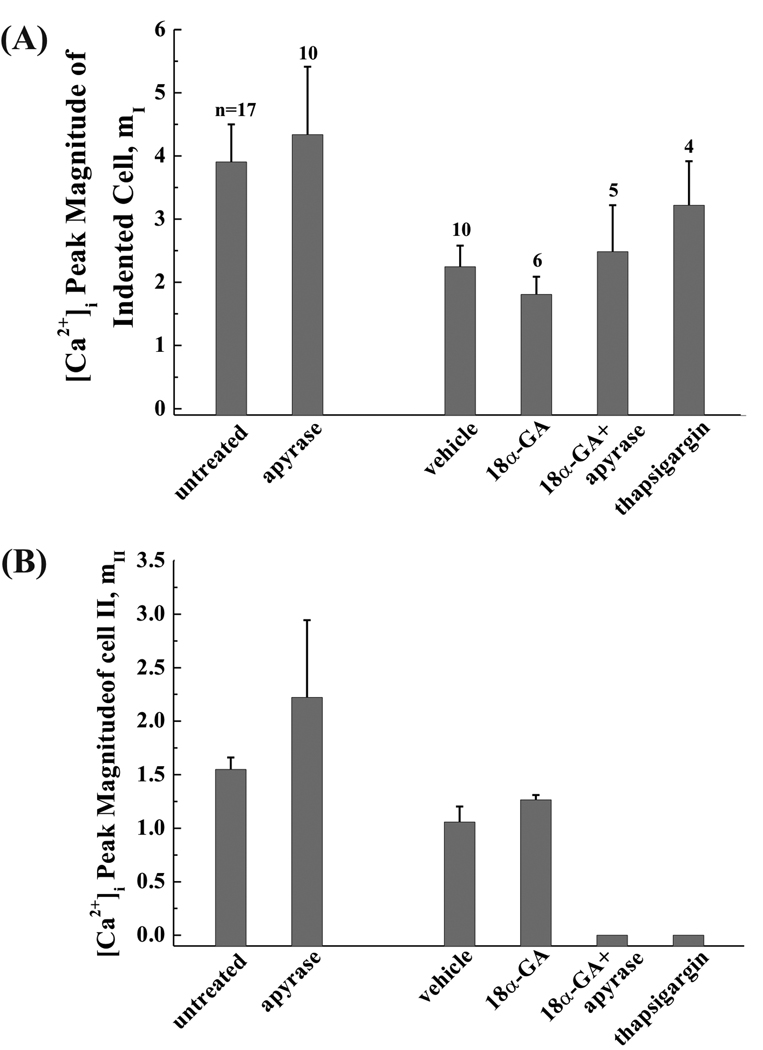
Figure 8.
The magnitude of [Ca2+]i peak for (A) the indented cell and (B) cell II. The apyrase-treated group was compared with the untreated group. Since DMSO was used in all the other groups, the results from these groups were compared with the vehicle (DMSO) control group. The numbers above data bars indicate the n number of experiments. The n numbers are the same for the indented cell and cell II.

