
Figure 5. RSFC for the default mode ICA component significantly predicted overall task- induced activity.
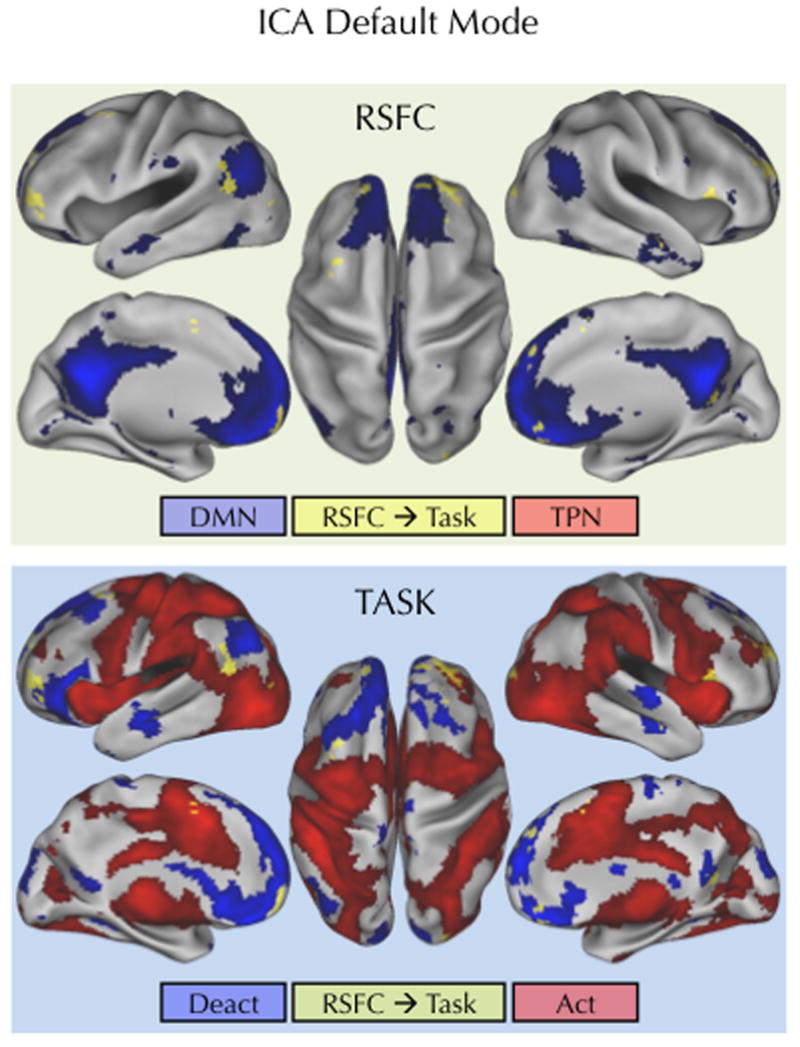
Regions (yellow) showing a significant relationship between RSFC for the ICA-based default mode component and overall task-induced activity (Congruent + Incongruent > Baseline) are overlaid on the default mode ICA component (blue). The bottom figure shows the same significant regions overlaid on overall task-induced activations (red) and deactivations (blue). Statistical maps were corrected for multiple comparisons using Gaussian random field theory (Z > 2.3; p < 0.05, corrected).