
Fig. 1.
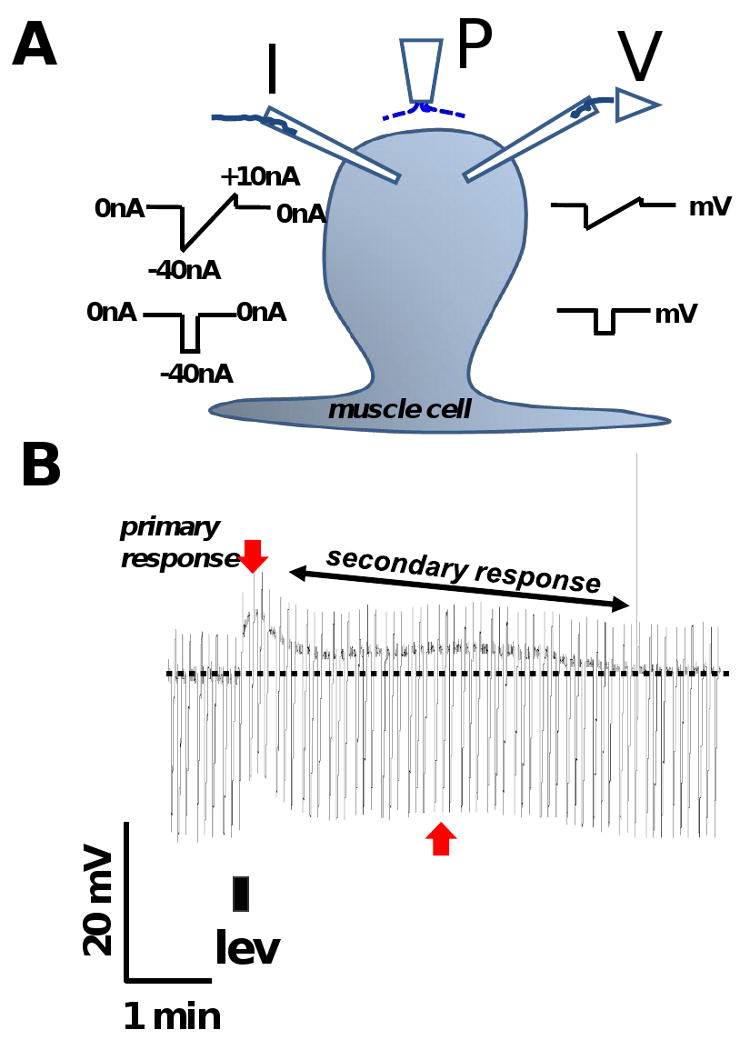
A: Diagram showing the placement of the two micropipettes used for current-clamp and position of the micro perfusion system for continuous perfusion and application of drugs. P: microperfusion pipette. I: current-injecting electrode, injects ramp currents or step currents. V: voltage-recording electrode.
B: Representative trace showing the levamisole response and its 2 components in APF-Ringer namely, a primary depolarization and a secondary depolarizing response (secondary response). The darkest line of the recording is the membrane potential and the downward transients are the responses to injected current. The rapid primary depolarization (downward red arrow) is followed by a slow secondary response (red vertical arrow and oblique black double arrow). 1 μM levamisole was applied for 10 s as indicated by the filled rectangle below the trace. The discontinuous horizontal line indicates the original position of the resting membrane potential. The width of the trace is a reflection of membrane conductance; it gets narrower as membrane-ion channels open. The duration of the secondary response (T80) was measured as the time taken (min) for the peak primary depolarization to decline by 80%.