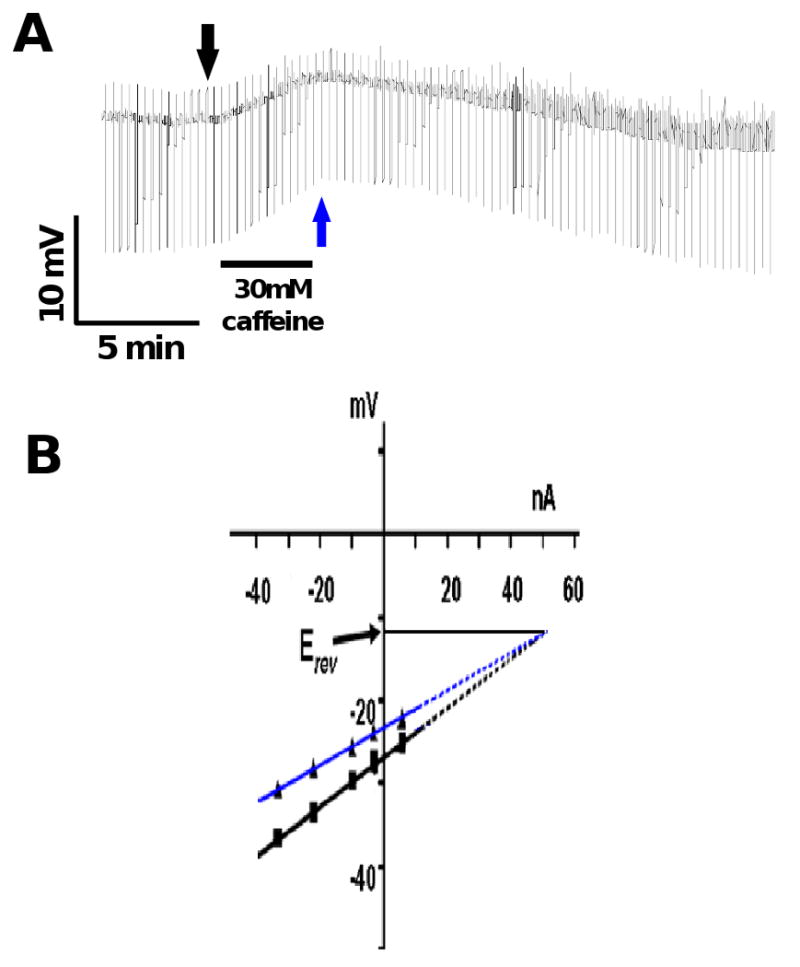
Fig. 6.

A: Current-clamp trace showing the effect of caffeine (30 mM) on the membrane potential and conductance. Note that the application of caffeine produced a slow depolarization associated with an increase in conductance.
B: The membrane potential responses to the injected ramp currents fitted with linear regression before application of caffeine (black arrow Fig. 6 A) and at the peak depolarization (blue arrow Fig 6A) in the IV plot. The reversal potential, Erev, estimated after extrapolating the membrane potential responses was -12 mV.
